The Supertrend indicator is a technical analysis tool that helps identify strong upward and downward trends. The indicator uses previous prices as input and compares the current price with the indicator’s line to determine the future price trajectory. The Supertrend indicator is beneficial in trending markets.
Calculation is as per below:
Upper Band = (High Price + Low Price)/2 + multiplier * Average True Range
Lower Band = (High Price + Low Price)/2 – multiplier * Average True Range
Average True Range = (Average True Range for n-1 periods * (n-1) + Current True Range)/n
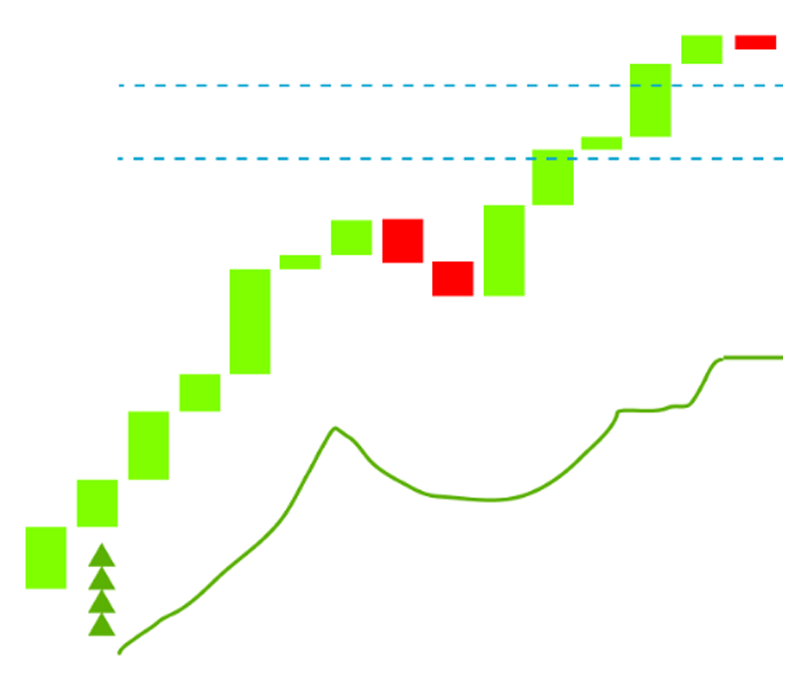
Formation of Supertrend indictor
Uptrend: When the price crosses above the upper band, the Supertrend line moves below the price and turns green, indicating a potential uptrend.
Downtrend: When the price crosses below the lower band, the Supertrend line moves above the price and turns red, indicating a potential downtrend.

Trading Strategy Using Supertrend And Moving Average Crossover
This is a simple strategy that uses the 5&20 EMA along with the supertrend indicator. In this strategy, when the 5 EMA crosses above 20 EMA and the supertrend indicator is below the share price (i.e. The supertrend is green), it is a good indication to enter a buy position.
