The Stochastic Oscillator is a momentum indicator developed by George C. Lane in the late 1950s. It is designed to compare the current closing price of an asset to a range of its prices over a specified period. The Stochastic Oscillator is particularly useful for identifying overbought and oversold conditions, as well as potential trend reversals. It helps traders assess the speed and direction of an asset’s price movement.
Why is the Stochastic Oscillator Important?
- Identifying Overbought and Oversold Conditions: The Stochastic Oscillator helps traders pinpoint when an asset’s price has reached extreme levels, suggesting a potential reversal.
- Revealing Potential Reversals: It is a valuable tool for detecting divergences between the indicator and price, which often precede reversals.
- Measuring Momentum: Traders use the Stochastic Oscillator to gauge the momentum of price movements, helping them make more informed trading decisions.

How Does the Stochastic Indicator Work?
Stochastics is a bounded oscillator which provides readings between 0 and 100. As a result, it is often used to generate overbought and oversold readings indicating a potential trend reversal.
An asset is considered overbought when its price has climbed too quickly and is now trading above its fair value. The expectation is that the market will likely correct the price downward soon. An asset is considered oversold when its price has fallen rapidly and is now trading below its fair value.
The standard default settings are 80 and 20. The stochastic readings above 80 mark are an indication that we have entered overbought territory while a reading below 20 is seen as oversold.
When the market is in overbought territory and the stochastic crosses back below the 80 level this is a sign that suggests momentum may be shifting from up to down. When the market is in oversold territory and crosses back above the 20 level then this is a sign that momentum may be shifting from down to up.
Traders occasionally alter these overbought and oversold levels to 85 and 15 as a means to reduce ‘false signals”. Widening the overbought and oversold levels will generate less signals so there is a balance to finding a quality signal with less market noise.
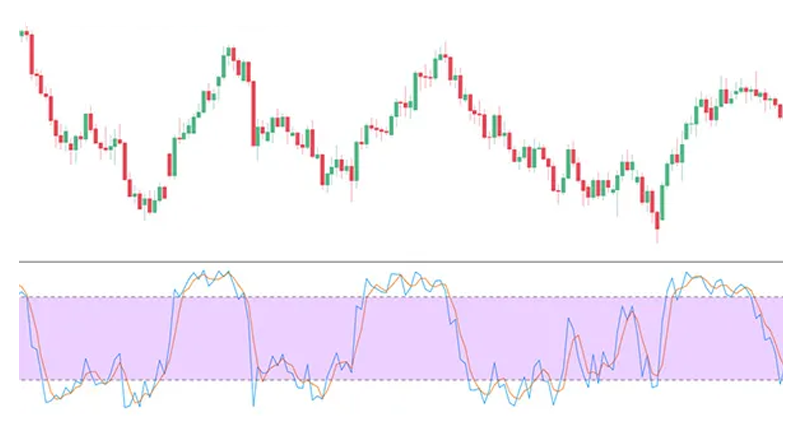
When you look at a stochastic, you’ll see the blue line %K and the red line %D. The blue line shows the current value of the oscillator for each trading session. The red line (sometimes a dotted line) is a three-day average of the blue values.When these two lines cross each other, it could mean that the trend might be about to change. This is because the crossing indicates a big change in momentum from one day to the next.
%K Line is in Blue
%D Line is in Orange

Example of the %K and %D lines on a chart for stochastic oscillator
You may notice there are two lines that appear on the chart. The second line, the %D line, is a moving average of the %K line.
%D is a 3-period simple moving average (SMA) of %K. It is also called the ‘stochastic slow’ due its slower reactions to market price changes, as compared to %K.
