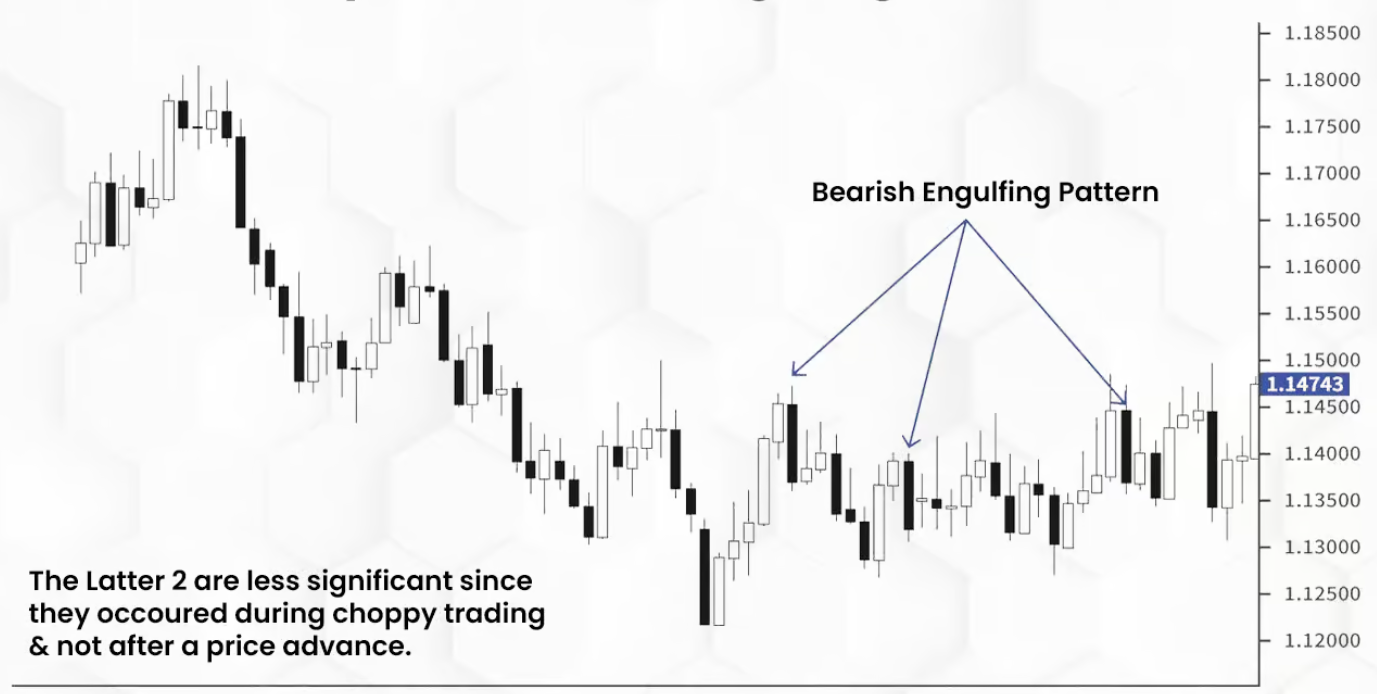
A bearish engulfing pattern produces the strongest signal when it appears at the end of an uptrend. The pattern is created by interpreting the data of two completed candles:
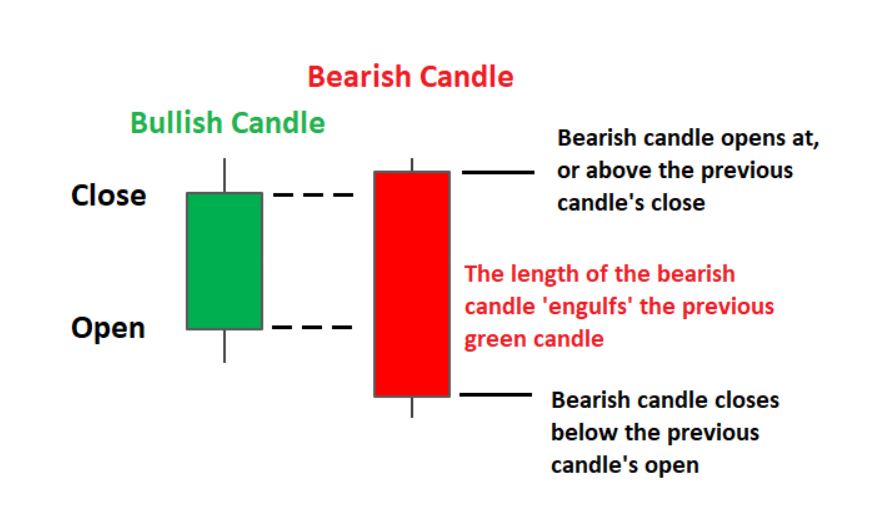
The first candle will depict the end of the established trend strength. It should be noted the size of this primary/bullish candle can vary but it is crucial that the body of this candle gets completely ‘engulfed’ by the candle that follows. Dojis and other small bullish candles provide the strongest signal as they can reflect market indecision in the current trend.
The second candle in the pattern is the reversal signal. This candle is comprised of a long red candle creating fresh downward price momentum. This bearish candle should open above the close of the previous candle and close well below the low of the previous candle. This strong downward movement reflects sellers overtaking buying strength and often precedes a continued fall in price. The further this secondary/ bearish candle declines, the stronger the signal becomes.
How to use Bearish Engulfing Candlestick Patterns in Technical Analysis?
Following are six steps on how to use colour of the bearish engulfing candlestick pattern engulfing candlestick patterns in technical analysis:Identify the pattern: Look for a smaller bullish candlestick followed by a larger bearish candlestick that completely engulfs the previous candlestick, including its shadows. This pattern signals a potential reversal in the uptrend.
Confirm the pattern: Look for confirmation of the pattern through other technical analysis tools such as trend lines, support and resistance levels, or indicators like the Relative Strength Index (RSI) or Moving Average Convergence Divergence (MACD).
Consider the volume: A bearish engulfing pattern is often accompanied by high trading volume, indicating strong conviction from market participants. Higher trading volume also confirms the validity of the pattern.
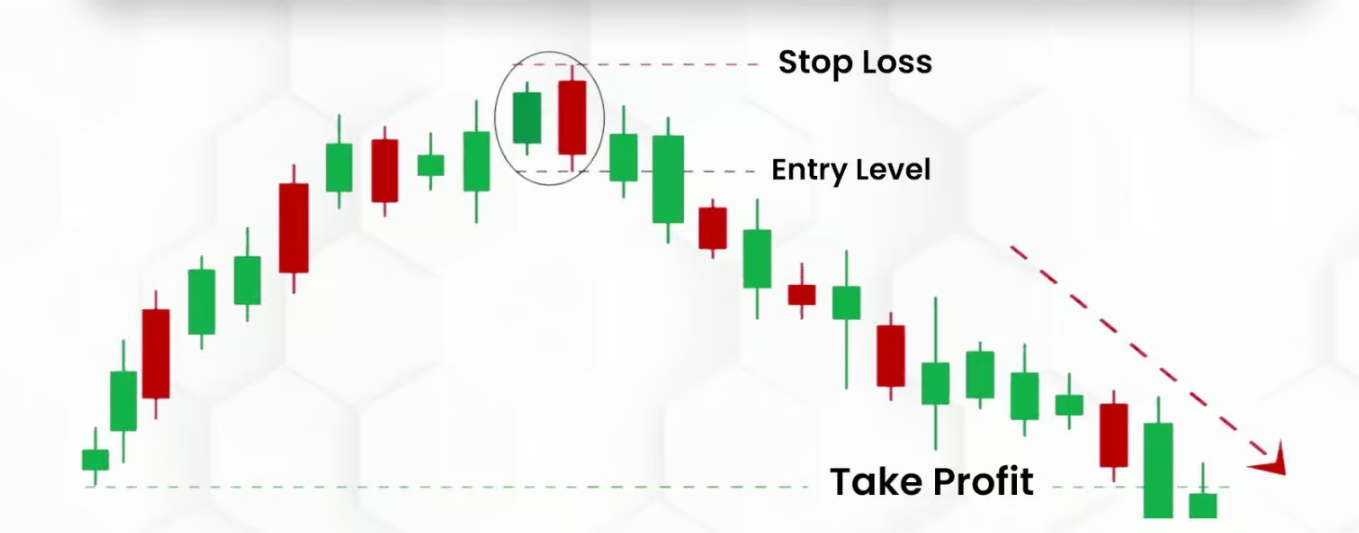
Place a stop-loss order: Place a stop-loss order below the low of the bearish candlestick to manage risk. This will protect against any unexpected price movements that may occur.
Take profits: Bearish engulfing patterns are often followed by a significant downtrend. Traders can consider taking profits at key support levels or using trailing stops to lock in profits as the price moves lower.
Monitor other market factors: Traders should monitor other market factors such as economic data, geopolitical events, and news announcements that may impact the price action, even when the bearish engulfing pattern is a strong signal.
What are Examples of a Bearish Engulfing Candlestick Pattern?
The first candlestick is a small bullish candlestick, and the second candlestick is a larger bearish candlestick that completely engulfs the previous bullish candlestick.
The second candlestick opens higher than the previous day’s closing price, indicating that the bulls are still in control. The bears take control during the session, and push the price down, causing the second candlestick to close below the previous day’s low.The pattern is accompanied by high trading volume, indicating strong conviction from market participants.