A triple top pattern is a chart pattern that indicates a potential reversal in an asset’s price trend. It appears as three consecutive peaks at similar price levels, with two troughs in between. The pattern is bearish, meaning it suggests a shift from a bullish to a bearish market.
How to identify a triple top pattern
- Peaks: The three peaks should be close in height and form a resistance level.
- Troughs: The two troughs should create a horizontal neckline.
- Break below neckline: The pattern is confirmed when the price breaks below the neckline.
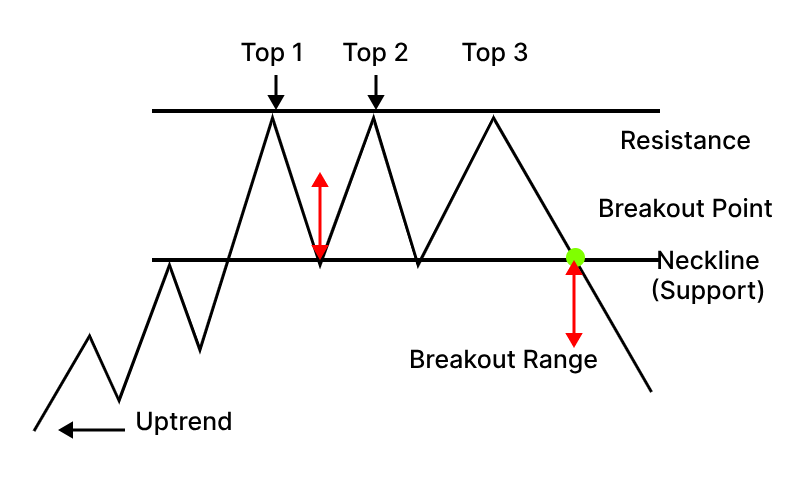
Interpretation of a Triple Top Pattern
- Bearish Reversal Signal: The Triple Top Pattern serves as a bearish reversal signal, indicating a potential shift in market sentiment from bullish to bearish.
- Resistance Level: The resistance level formed by the three peaks acts as a significant barrier for further upward movement.
- Price Targets: By measuring the pattern’s height and projecting it down from the breakout point, traders can estimate potential price targets for the downward move.
What Indicators Work Best with the Triple Top Pattern?
- Volume
- Moving Averages
- Relative Strength Index (RSI)
- Fibonacci Retracement Levels
How to trade Triple Top Pattern?
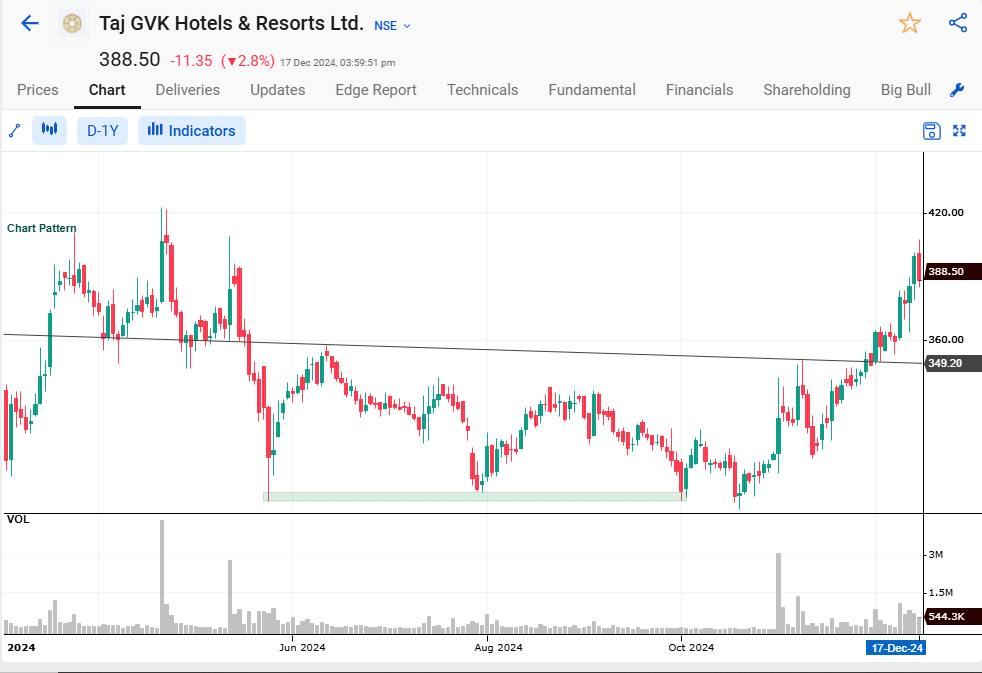
Taj GVK Hotels & Resorts Ltd. formed a triple bottom pattern, and since then, the stock price increased.
But what should the entry, target, and stop loss be for the triple bottom pattern?
Entry: Once the stocks break out above the resistance level, you can enter the trade.
Target: The distance between the bottoms and the resistance level from the breakout point becomes the target for the triple bottom pattern.
Stop Loss: The low of the third bottom is ideally considered as stop loss for the triple bottom pattern.
Advantages
- Triple top candlestick pattern offers an early alert of buying pressure and the potential trend change ahead. Traders can prepare for reversals in advance.
- The entry near support with stops higher, the triple peaks will offer a defined risk point. Profit targets are open below support, offering a favourable risk-reward situation.
- According to statistical research, the triple top often resolves in the predicted direction once support breaks. This high chance of success boosts the trading edge and profit potential.
- The pattern establishes an objective environment for completing or avoiding transactions. Traders wait for precise setups instead of overtrading without a strategy. This boosts the victory rate.
Disadvantages
- Sometimes, support breaks temporarily before the price returns above it. This false breakdown invalidates the pattern, resulting in lost trades.
- The pattern can be nullified if resistance breaks to the upside. Traders must swiftly exit losing deals when patterns collapse.
- Triple tops are best suited for trending markets. Range-bound situations cause frequent failures and pauses to occur.
- The pattern should ideally coincide with other technical indicators to confirm the reversal with a higher likelihood of its happening.