A head-and-shoulders pattern is a chart pattern that indicates a potential trend reversal in the stock market. It’s made up of three peaks, with the middle peak being higher than the other two.
How it forms
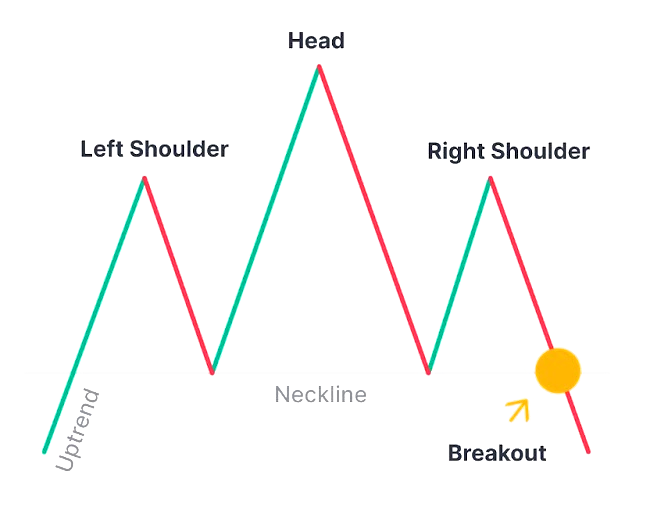
- The price increases and reaches a peak
- The price declines to the base of the previous up-move
- The price increases again, forming a higher peak, or “head”
- The price declines again, forming the “right shoulder”
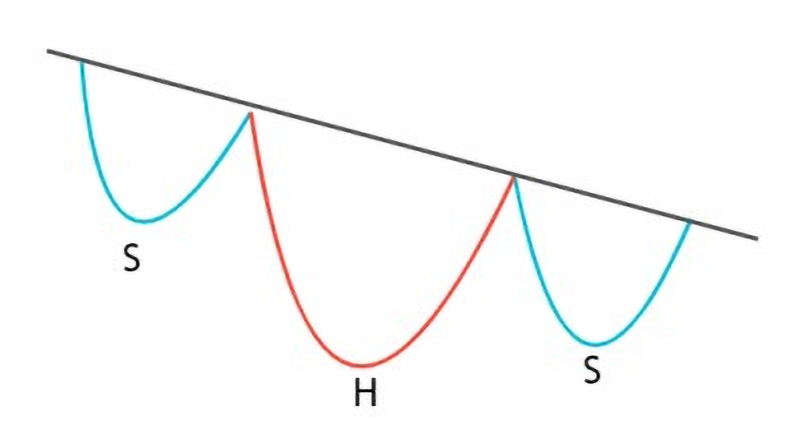
Inverse head and shoulders pattern
Head and shoulders is a bearish pattern in the forex technical analysis whereas the inverse head and shoulder pattern is a bullish pattern. It’s the same as a head and shoulder pattern like three swings and it forms at the end of a bearish trend.
Example of Head and Shoulders Pattern
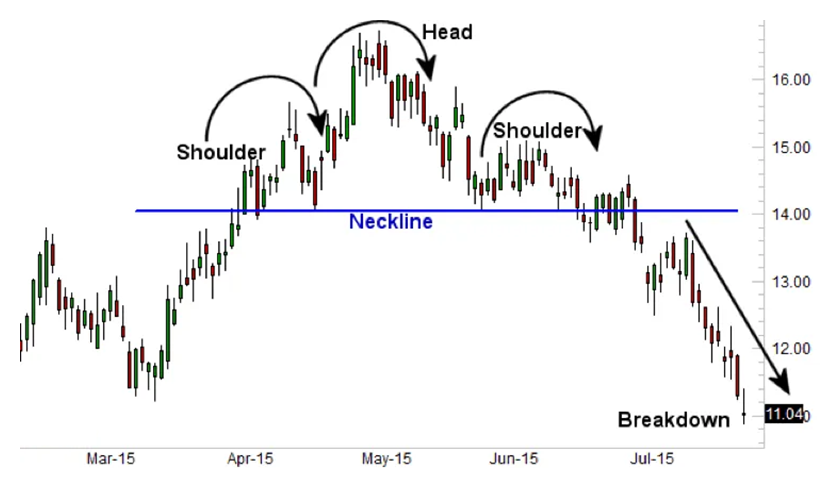
This picture is a clear representation of the three parts of this pattern–two shoulder areas and a head area that the price moves through in creating the pattern signaling a market reversal. The first “shoulder” forms after a significant bullish period in the market when the price rises and then declines into a trough. The “head” is then formed when the price increases again, creating a high peak above the level of the first shoulder formation.
From this point, the price falls and creates the second shoulder, which is usually similar in appearance to the first shoulder. Importantly, the initial decline does not carry significantly below the level of the first shoulder before there is usually either a slight retracement upward or a flattening out of price movement.
The pattern is completed, giving a market reversal signal, when the price declines again, breaking below the neckline. The neckline, as depicted above, is the horizontal line that connects the first two troughs to one another.
Example of Inverse Head and Shoulders Pattern
To identify this formation on the chart, you need to find a downtrend, which is close to a reversal. To determine whether the trend is becoming weaker, you can use trend strength indicators like ADX. Another sign of a weakening trend is its length. You can identify the average length of a trend on a timeframe you trade and compare it to the one you plan to trade in.
Once you find a weakening trend, you can draw the inverse head and shoulders formation.
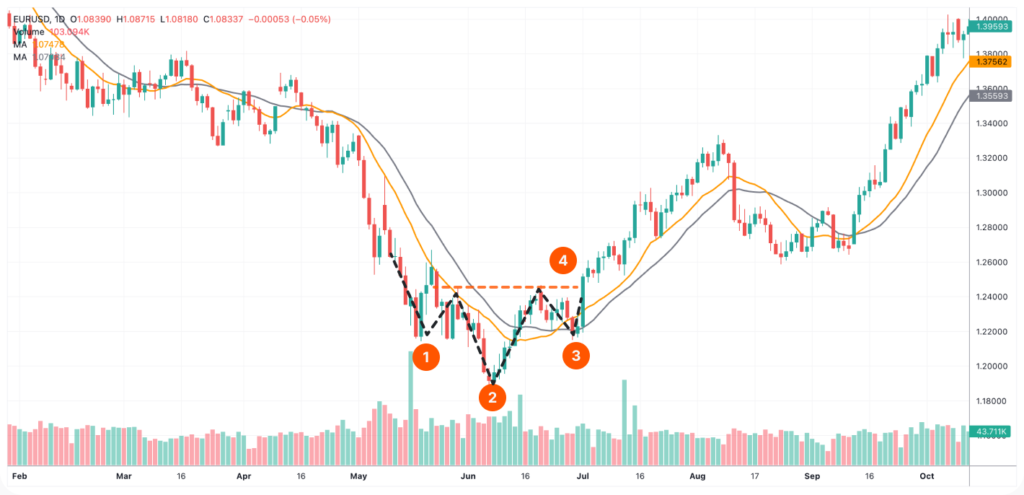
The price should rebound from a low to form a left shoulder (1). Next time, in the inverse head and shoulders pattern, selling volumes should increase, so the price will break below the previous low and form another one (2). This will be a head. The price should rebound again. In the third attempt, bears will pull the price down but won’t be able to reach the previous low (3), and the price will rebound almost at the same level as the left shoulder. This will be the right shoulder. After it has formed, bulls are likely to push the price above the resistance level. The resistance level, in turn, is drawn through the peaks between the head and shoulders (4).
The construction is simple – you need to find two troughs at almost the same level with a lower one in between at the end of a downtrend.
Advantages and Disadvantages of the Head and Shoulders Pattern
Advantages
- Experienced traders identify it easily
- Defined profit and risk
- Big market movements can be profited from
- Can be used in all markets
Disadvantages
- Novice traders may miss it
- Large stop loss distances possible
- Unfavorable risk-to-reward possible