A double bottom, also referred to as a W bottom pattern, is a technical analysis formation indicating a potential reversal from a downtrend to an uptrend. It is widely used by traders to define future price movements and identify buying opportunities.
What Does the Double Bottom Pattern Tell You
The double bottom patterns on the chart indicate the asset price has reached a strong support level for buyers. This is a reversal pattern that signals a likely bearish-to-bullish reversal.
It should be emphasized that the greater the distance between two bottoms, the higher the probability of a trend reversal and pattern completion. This is because the bulls show their strength and intention to increase the price while not allowing the bears to go below the critical point.
But there are times when buyers fail to hold their positions, and quotes break through the support line under the selling pressure. As a rule, this can occur because of fundamental negative factors for the asset.
In technical terms, double bottom patterns form in a downtrend and signal a soon trend reversal up.

Formation of Double Bottom Pattern
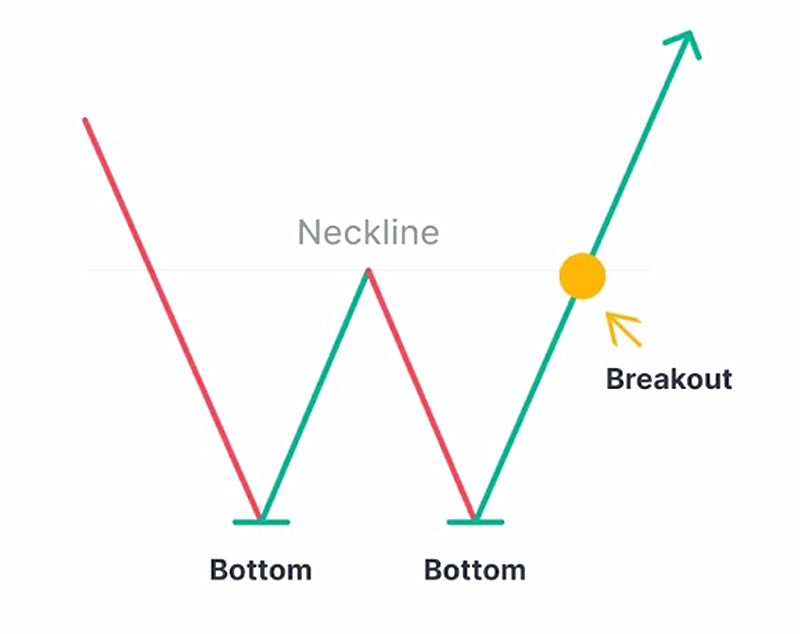
First low – The market bounces higher and forms a swing low. At this point, it’s likely a retracement in a downtrend.
Second low – The market rejects the previous swing low. Now, there’s buying pressure, but it’s too early to tell if the market could continue higher.
Break of neckline – The price broke above the Neckline (or Resistance) and it signals the buyers are in control — the market is likely to move higher (this is also where you look for trading opportunities when it comes to double bottom trading)
Example
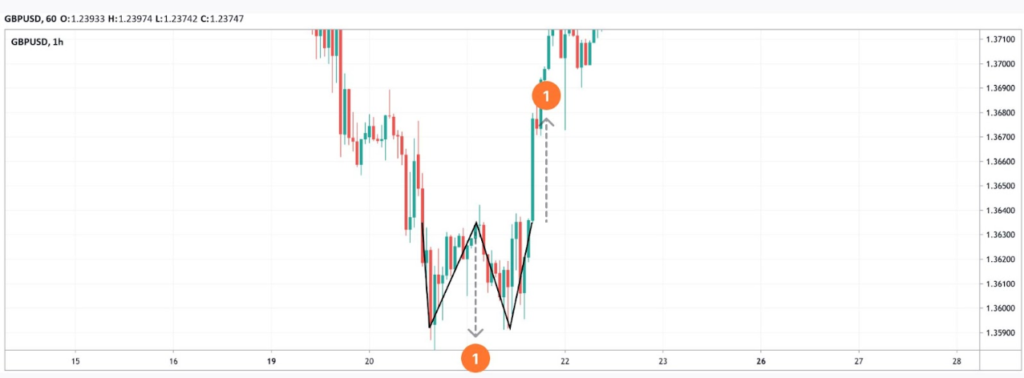
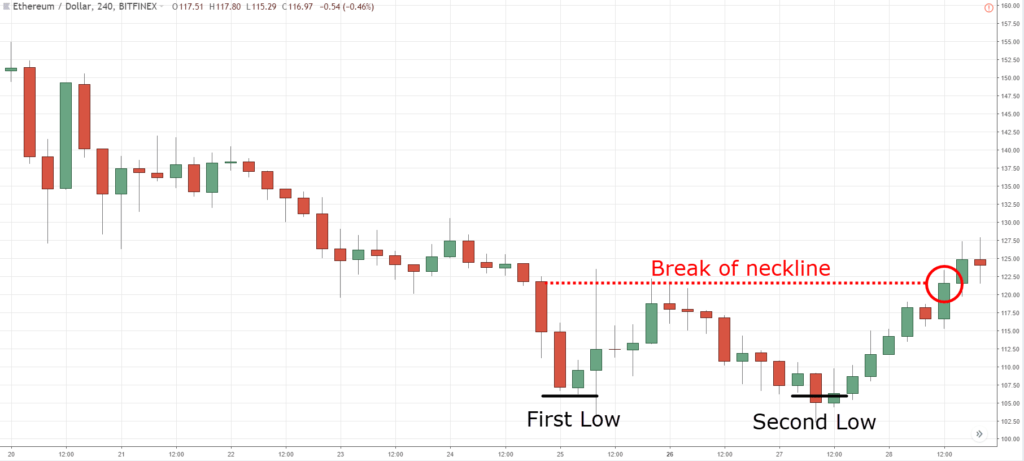
On the chart above, the price formed a double bottom setup at the end of a downtrend. According to the common rule, the price moved the distance equal to the difference between the neckline and the bottoms (1). If a trader waited for the breakout candlestick to close, they would miss the opportunity to trade with the pattern. Therefore, when noticing a large trading volume, a trader could go long at any time the breakout candle was forming.
A take-profit target would equal the distance between the neckline and the bottoms regardless of the entry point. However, as the rise continued, a trader could trail a take-profit level. The stop-loss would depend on the entry point and the take-profit level, but if it equalled a 1:2 or 1:3 risk/reward ratio, the trade would be effective.
How to Confirm a Double Bottom Chart Pattern?
A double bottom setup can be confirmed with standard technical analysis tools. As a trader uses a breakout to enter the market with this formation, trading volumes can be used as a barometer of the bulls’ strength. If trading volumes grow when the price rises above the neckline, the price is more likely to continue surging.
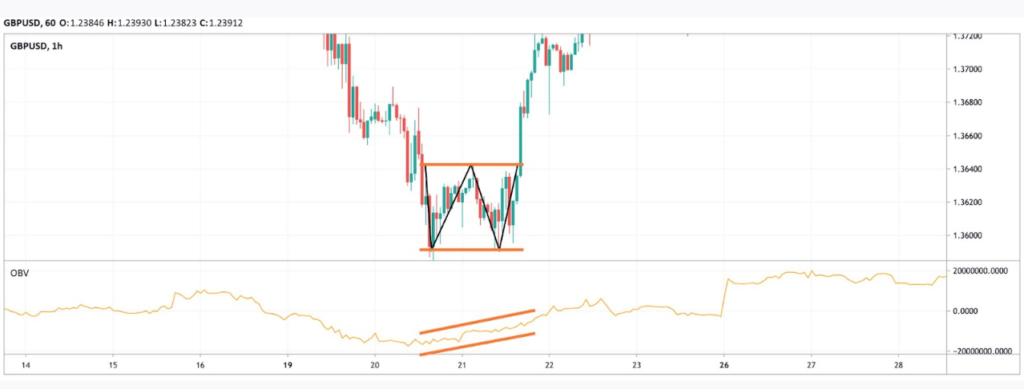
On the chart above, the on-balance volume (OBV) indicator is growing, although the price is consolidating. It’s the first sign the price will break above the neckline and keep rising.