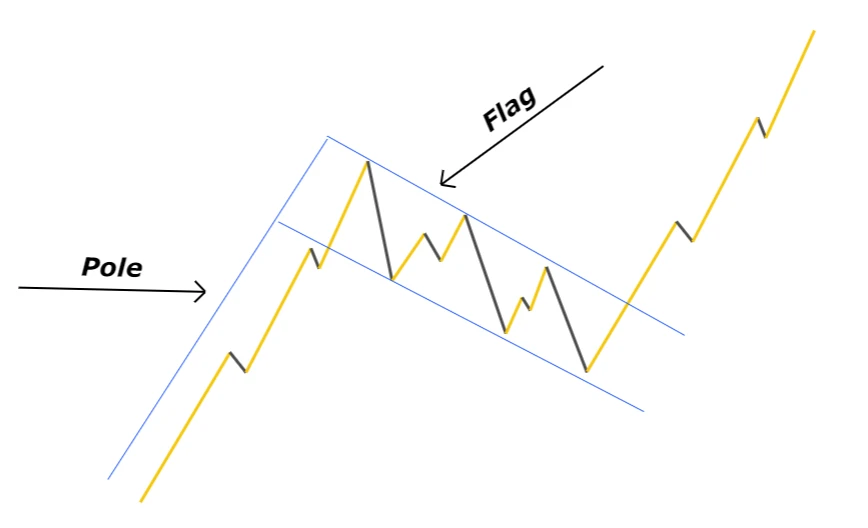
The bull flag is a continuation chart pattern that consists of two waves and resembles the shape of the flag in technical analysis trading.
When bullish flag pattern forms on the price chart then it signals that price will continue the bullish trend. It is the most widely used and easy-to-understand chart pattern. The flag pattern has a high winning probability because it only signals in the direction of the trend.
What does flag pattern tell traders?
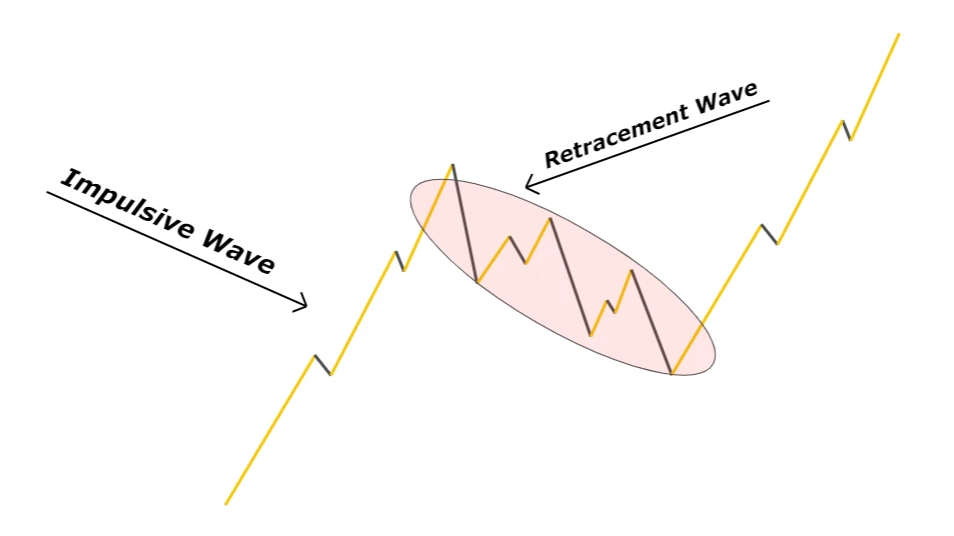
As the market consists of two phases
- Impulsive phase
- Retracement phase
After the impulsive phase, the retracement phase must happen or after the retracement phase, the impulsive phase must happen. Retracement on the chart is an indication of a big bullish or bearish trend.
In a bullish flag pattern, prices continue retracing downward in the form of a channel. In the retracement, big traders and institutions take profits from the market, and prices keep retracing downward. Market makers want the price to come to a level where they have put their pending orders.
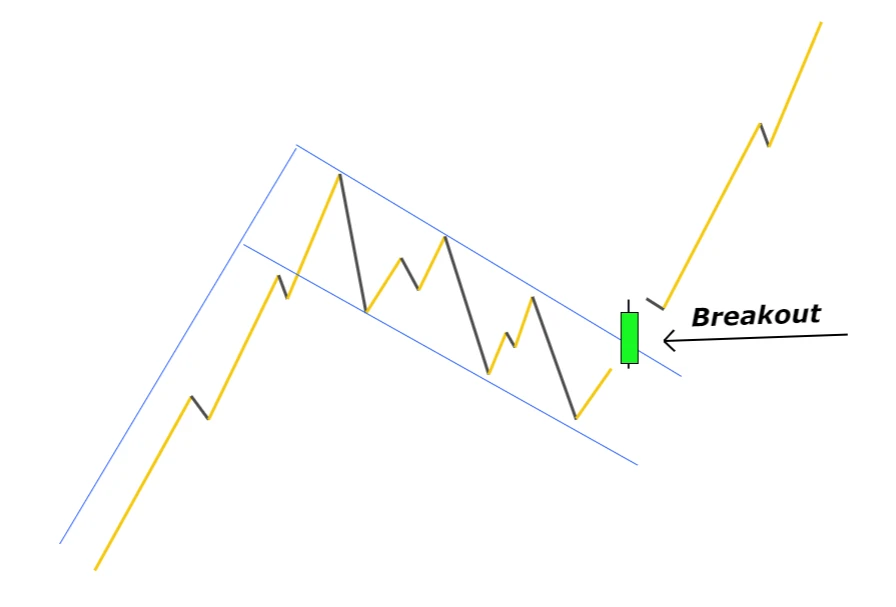
After execution of pending buy orders, the price will break the channel and continue to move upward. After the breakout of the channel, the impulsive phase starts.
Trading plan for bull flag pattern
When to open a buy trade
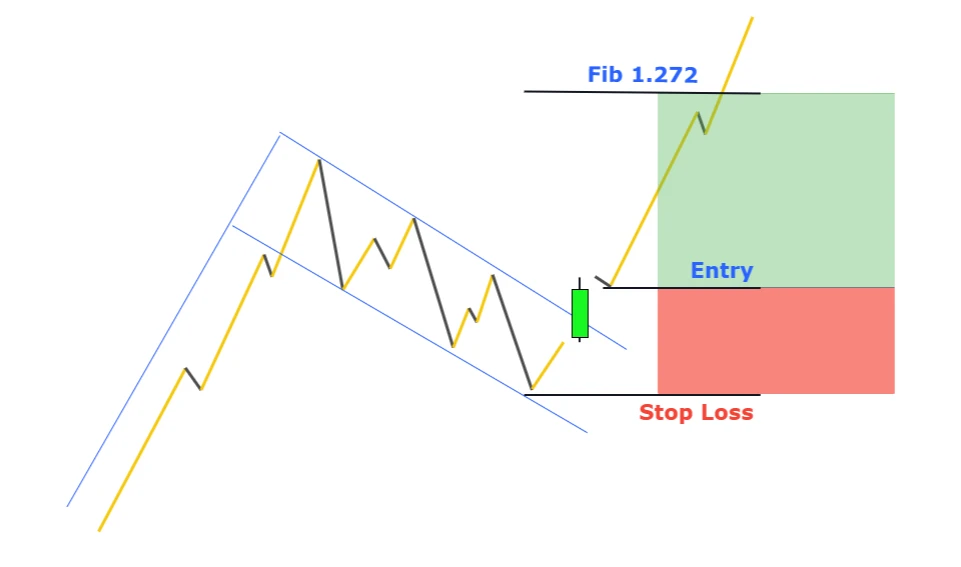
The flag of the bull flag pattern is similar to the shape of a channel. The channel consists of an upper trend line and a lower trend line. A buy signal is generated when the price breaks the upper trend line.
Stop-loss Level
Place a stop loss below the lowest low made by the price after the breakout of the trendline.
Take-profit level
Close half trade at the last higher high made by the price. Apply the Fibonacci tool on the retracement wave and highlight the 1.272 Fibonacci extension level. Close the rest of the trade at 1.272 Fibonacci level.
Risk management
Risk only two percent of the total account balance per single flag pattern trade. The risk-reward should be greater than 1:2. Don’t trade the patterns that offer a low risk-reward ratio.
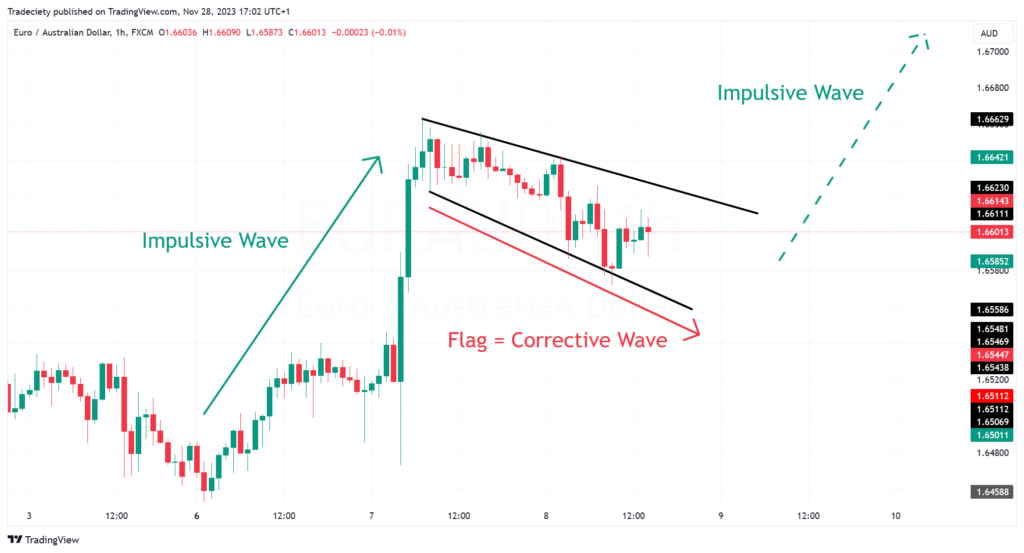
Example
The first step when it comes to finding bull flags is making sure that the instrument is in a trending market environment. The strong impulsive trend wave in the screenshot below confirms that the instrument is indeed overall in a trending market.
Many traders make the mistake of chasing the price as a bullish trend keeps pushing higher during the impulsive wave. Such a trading approach usually doesn’t perform as well because of a high likelihood of a pullback.