The ascending triangle pattern is a reversal or continuation price chart pattern that resembles the shape of a triangle with a base on the upper side. It is a price Pattern that forecasts the future price of an asset or currency pair.
- This chart pattern will acts as a continuation chart pattern if it forms in the mid of the trend
- Ascending triangle Will act as a reversal chart pattern if it forms at the top or bottom of the price chart.
How to identify ascending triangle Patterns?
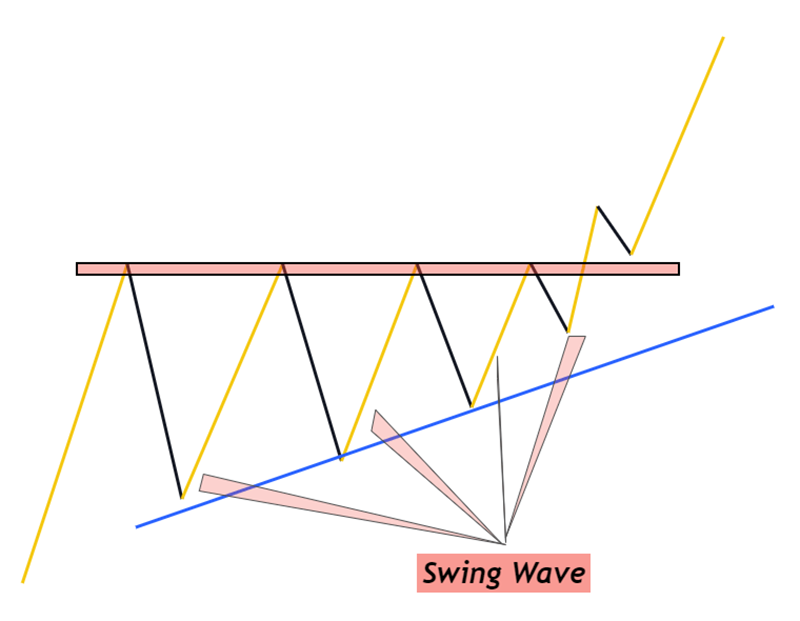
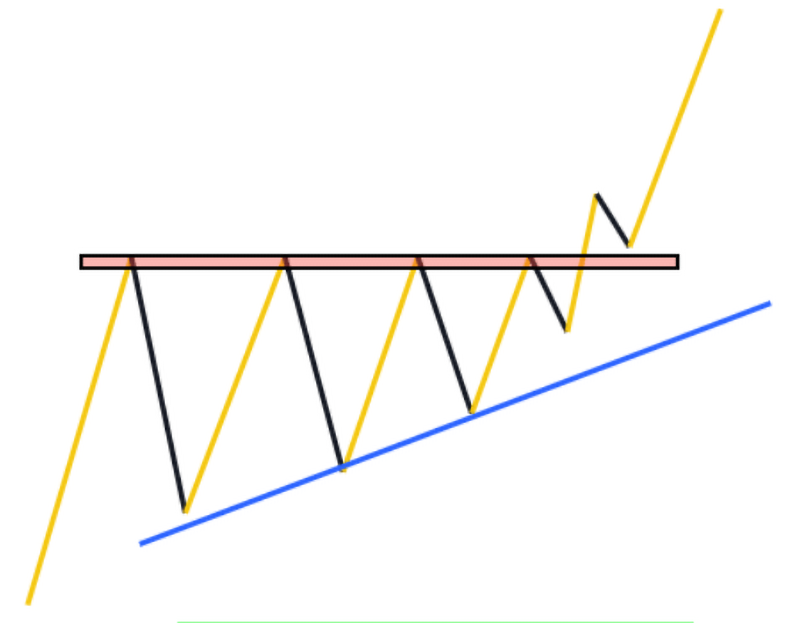
- Higher low of each progressive wave Should be greater than previous wave. It will form a shape of rising trendline.
- The swing waves should form in a clear format. Avoid choppy makret environment.
- At least three swing waves should form in triangle pattern. A price Pattern will not be considered an ascending triangle if it has less than three swing waves.
Working method of ascending triangle pattern
Ascending triangle pattern is neither bullish nor a bearish chart pattern. The breakout of trendline or base decides either price will go up or down. That’s why it will act as both reversal or continuation chart pattern. Only location and breakout decide the nature of the chart pattern.
- Ascending Triangle Continuation Pattern
- Ascending Triangle Reversal Pattern
- Ascending Triangle Continuation Pattern
If price breaks the base or resistance zone of ascending triangle pattern due to the large momentum of buyers, then this price pattern will act as a continuation chart pattern in trading.
- . Ascending Triangle Reversal Pattern