Descending broadening wedge is a bullish trend reversal chart pattern that consists of an expanding wave in the downward trend. It is an indication of a long-term trend reversal in the market.
Retail traders widely use chart patterns to forecast the market. Because these are natural patterns, and symmetry in these patterns makes them unique.
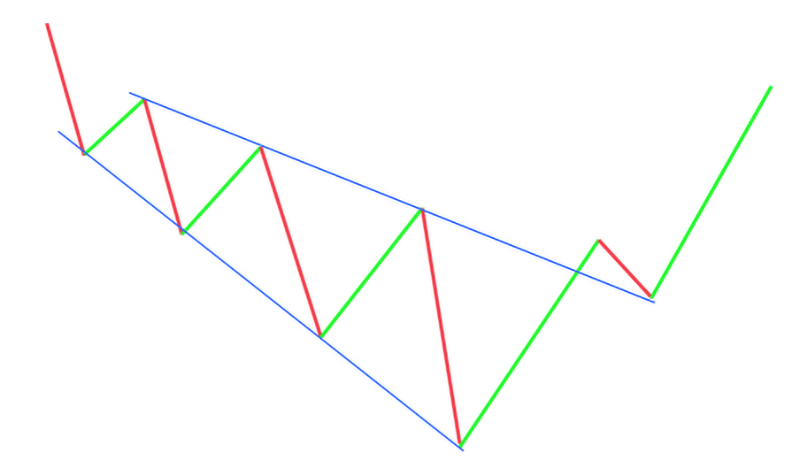
How to identify descending broadening wedge pattern?
- Identify the starting point of the wave. The price wave should make lower lows and lower highs.
- Each upcoming wave should be greater in size than the previous wave.
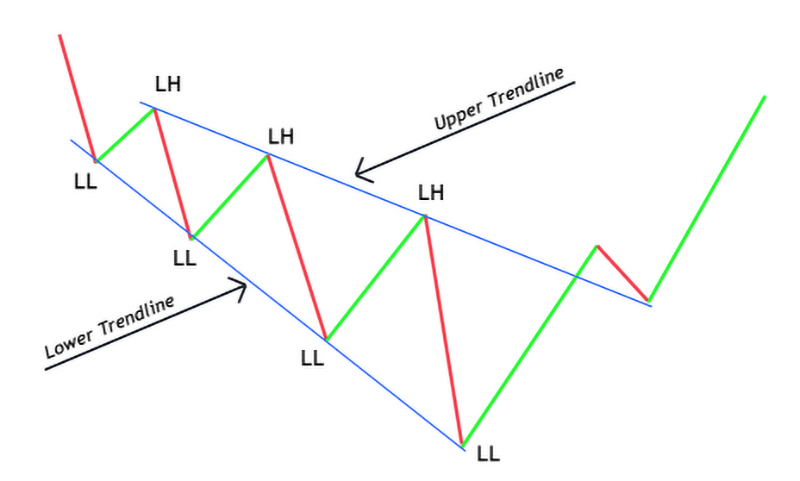
- Draw two trendlines meeting the swing high and swing low points of waves.
- The starting point of this wedge pattern should be thin, and the ending point should be thick.
- There must be at least three waves in the descending wedge pattern.
What does the descending broadening wedge tell traders?
Descending broadening wedge patterns can also be mastered by the price action technique because the currency chart will be full of false signals and trade ideas. You can also profit by filtering out the good trades from the crowd. And you can filter only when you have experience in trading this chart pattern.
How to trade descending broadening wedge?
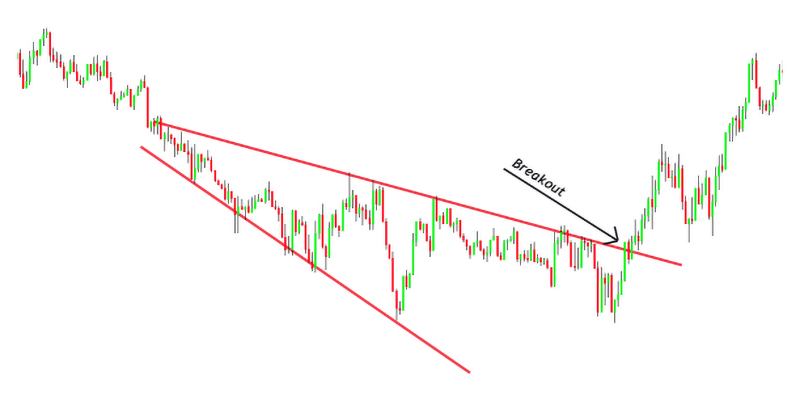
- Draw two trendlines meeting the highs and lows of waves. There must be at least three waves within the wedge pattern.
- Wait for the breakout of the upper trendline with a big candlestick.
- After the breakout, there are two scenarios. You can open a buy trade just after the breakout or wait for the price to retrace after a breakout to get a high-risk reward trade setup. The latter option is a bit conservative, but it is an excellent option to go with.
- Place stop-loss below the last lower low made by the price wave.
- Adjust the take profit level to the starting point of descending broadening wedge pattern.
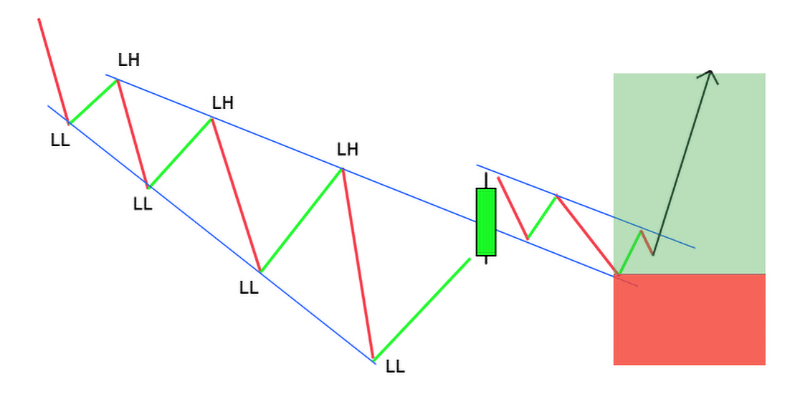
Example
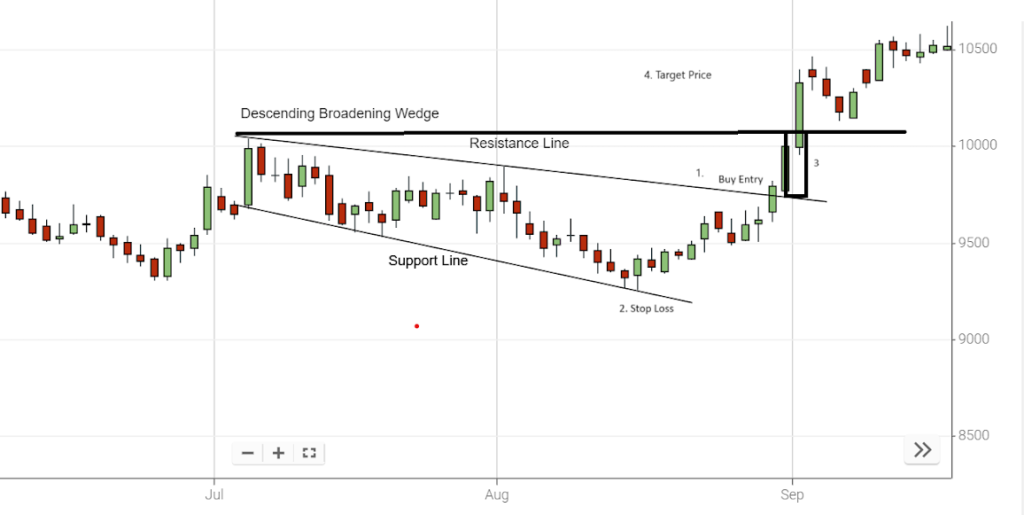
The chart below illustrates the buy order and the specific region where the price has breached the upper trend line of the wedge
The stop loss should be set below the lower side of the descending wedge pattern.
Lastly, the chart displays the profit target, determined by measuring the height of the back of the wedge and extending that distance upward from the trend line breakout point.
Resistance Line: At least two high points are essential to establish the upper resistance trend line. Lower highs in the price action are necessary to validate the descending broadening wedge pattern.
Support Line: A minimum of two low points is needed to draw the lower support trend line. Lower lows in the price action are crucial for the pattern to be considered valid.