A “triple bottom” chart pattern in technical analysis indicates a potential bullish trend reversal, occurring when a price hits the same low level three times consecutively during a downtrend, suggesting that buyers are gaining strength and the market is shifting from bearish to bullish sentiment; it is considered a positive signal once the price breaks above the resistance level formed between the lows.
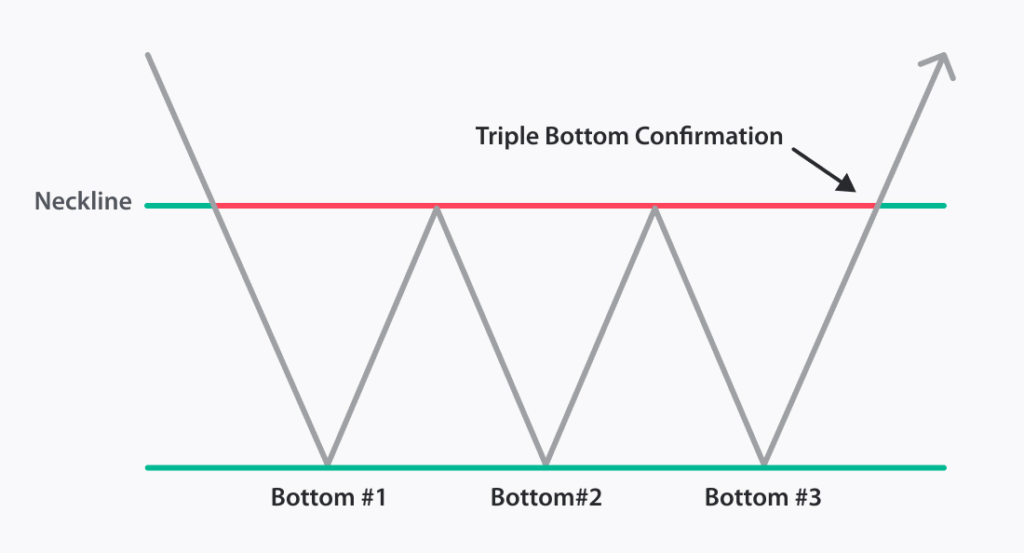
How to identify correct triple bottom trading pattern?
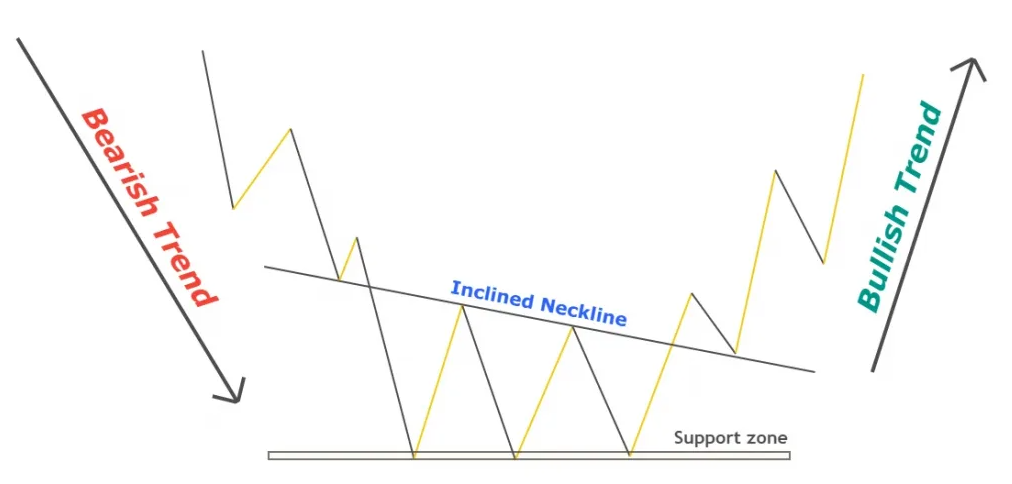
There are three steps to identify a valid triple bottom chart pattern in trading.
- Identify bearish trend (formation of consecutive lower lows and lower highs).
- Draw a valid support zone using two swing waves
- sketch a valid neckline meeting the two touches of swings.
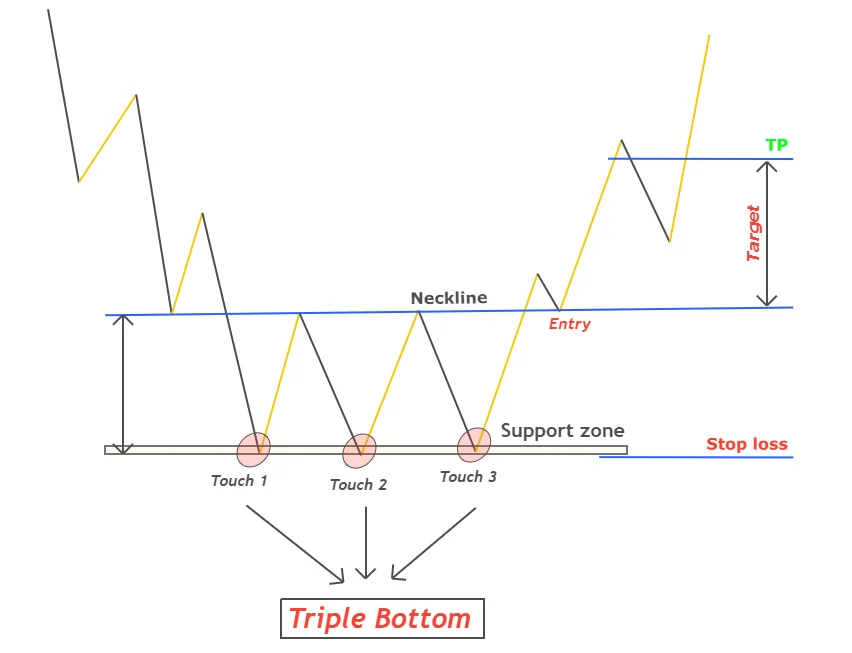
How to trade triple bottom stock chart pattern?
The triple bottom pattern completes after the breakout of the neckline. After neckline breakout, we will open a trade position and adjust our stop loss and take profit levels.
An Example of Triple Bottom Trading
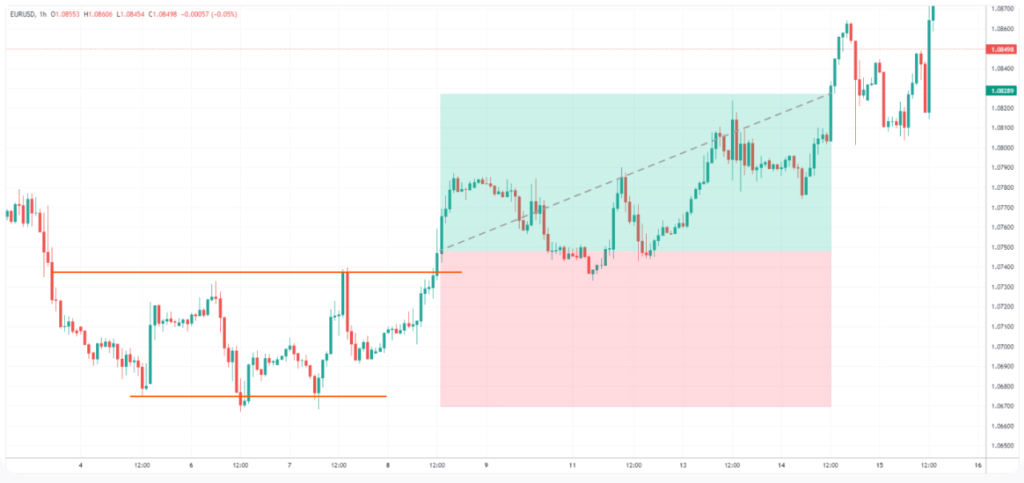
A trader identifies a triple bottom on the EURUSD chart. They enter the trade when the price breaks above the resistance line and place a stop loss below the setup. The take profit is set at a level similar to the height of the formation. In the example above, the risk/reward ratio is 1:1. It can be increased to lower risks by placing a stop-loss slightly below the resistance level.
Limitations of a Triple Bottom
- False Breakouts:Sometimes, the price may break above the resistance level but fail to sustain the upward movement. This results in a false breakout, causing potential losses for traders who entered bullish positions.
- Market Conditions:The effectiveness of the Triple Bottom pattern may vary depending on the market conditions. In volatile or choppy markets, the pattern may not provide reliable signals.
- Confirmation Signals:Traders must use additional indicators and confirmatory signals to increase the accuracy of the Triple Bottom pattern. Relying solely on this pattern may lead to false signals and unsuccessful trades.